China Best Demagnetization Curves Suppliers for Global Buyers

Time:2026-09-18 Author:Mason
0%

For global buyers, selecting reliable Demagnetization Curves suppliers requires more than comparing prices or catalog values. A curve is a practical map of magnetic behavior. It shows how remanence, coercivity, and energy product change under an opposing magnetic field. These details influence motor efficiency, sensor stability, speaker performance, and magnetic separation systems.

Professor J. M. D. Coey, a respected authority in magnetism, has stated, “Magnetism is a subject where structure, processing, and properties cannot be separated.” This principle matters when evaluating suppliers. A trustworthy manufacturer should explain the tested material grade, sample geometry, temperature, measurement method, and field strength. Without this information, two attractive curves may not be comparable. That small gap can become a costly engineering mistake.

Experienced suppliers also provide traceable test reports, calibrated equipment records, and technical support after delivery. Buyers should inspect whether the curve reflects real production batches rather than one carefully selected sample. Ask for data at operating temperatures, especially for neodymium, ferrite, samarium cobalt, and bonded magnets. The printed line may look smooth, but the application can be demanding.

Not every supplier communicates equally well. Some documents remain incomplete. That deserves attention, not quick approval. A stronger sourcing process combines laboratory evidence, manufacturing experience, responsive communication, and realistic tolerance data. The best Demagnetization Curves suppliers do not merely sell magnetic components. They help buyers understand performance before production begins, while admitting where measurement uncertainty still exists.
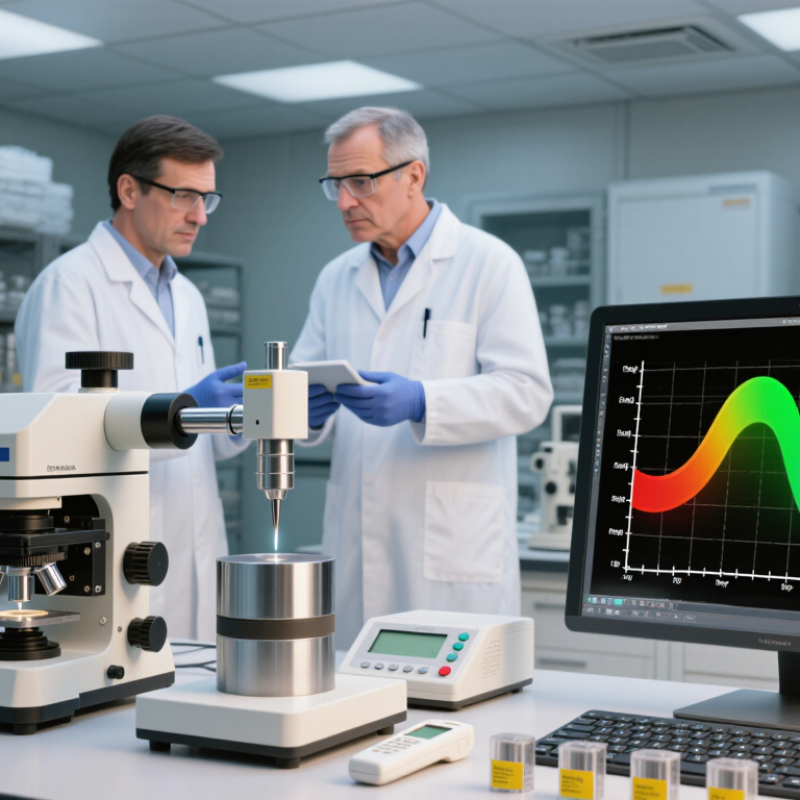
China Best Demagnetization Curves Suppliers for Global Buyers

What Demagnetization Curves Measure: Br, Hcj, Hcb, and (BH)max

Demagnetization curves reveal how a permanent magnet behaves after magnetization and during opposing-field exposure. For global buyers, these curves provide more useful evidence than a single grade label. Reliable suppliers should present test conditions, specimen dimensions, temperature, and measurement standards clearly.

Br is the remanent flux density, measured when the external field returns to zero after saturation. It indicates the magnetic flux a material can retain.

Hcb is the normal coercivity, where magnetic flux density B reaches zero.

Hcj is the intrinsic coercivity, where polarization J reaches zero. Hcj usually better reflects resistance to irreversible demagnetization, especially in motors, sensors, and compact assemblies.

The distinction matters. Confusing Hcb with Hcj can lead to an unsafe design margin.

(BH)max

represents the maximum energy product in the second quadrant of the curve. It helps engineers estimate magnetic energy stored per unit volume. A higher value can support smaller designs, but it does not guarantee better performance in every application.

Temperature changes, machining stress, surface damage, and nearby steel can alter the working point. Test results should therefore match real operating conditions whenever possible.

In practice, experienced quality teams inspect curve smoothness and repeatability, not only peak numbers. They also compare several samples from different production batches. One test is not enough.

I have found that small preparation errors can distort low-field results. That detail is easy to overlook. Buyers should request raw curve data and calibrated test records before approving a shipment.

How NdFeB, SmCo, AlNiCo, and Ferrite Curves Differ by Temperature

China Best Demagnetization Curves Suppliers for Global Buyers

Selecting a demagnetization curve requires more than comparing room-temperature strength. The curve shows how magnetic flux changes as temperature and opposing fields increase. Reliable suppliers should provide measured data for each grade, test direction, and operating temperature.

NdFeB magnets usually deliver high energy density, but their curves can shift sharply with heat. A motor near 120°C may lose useful flux if the working point approaches the knee. SmCo generally retains magnetic performance better at elevated temperatures, making its curve more stable in hot sensors and aerospace equipment. Temperature matters greatly.

AlNiCo has strong remanence, yet its low coercivity creates a softer demagnetization curve. A nearby steel component or reverse field can reduce its magnetization. Ferrite shows lower magnetic strength, but its curve often changes more gradually across common industrial temperatures. It also tolerates many outdoor applications well. Geometry still matters. A long magnet and a short magnet made from the same material may operate at different points on the curve. Supplier certificates should identify test standards, tolerances, and irreversible loss after heating. I have seen designs rely on one attractive curve and ignore assembly stress. That mistake can become expensive. Curves are guides, not guarantees. Prototype testing under real load, airflow, and temperature cycling remains necessary.

China Best Demagnetization Curves Suppliers for Global Buyers - How NdFeB, SmCo, AlNiCo, and Ferrite Curves Differ by Temperature
Magnet Material Typical Remanent Induction, Br at 20°C Typical Intrinsic Coercivity, Hcj at 20°C Typical Maximum Energy Product, (BH)max Typical Temperature Coefficient of Br Typical Recommended Maximum Operating Temperature Typical Curie Temperature Demagnetization-Curve Behavior as Temperature Rises Temperature Points Commonly Used for Curve Testing Primary Design Consideration
NdFeB 1.0–1.5 T 750–3,000 kA/m 80–440 kJ/m³ Approximately −0.10 to −0.13%/°C 80–200°C, depending on grade and required temperature margin Approximately 310–400°C Br decreases noticeably with temperature. Hcj also falls, and the operating point can move toward the knee of the second-quadrant curve. Low-coercivity grades are more vulnerable to irreversible thermal demagnetization. 20°C, 80°C, 120°C, 150°C, and 180°C are commonly selected according to the application. Maintain sufficient coercivity and load-line margin, especially in motors, generators, actuators, and applications exposed to rapid temperature changes.
SmCo 0.8–1.15 T 450–2,400 kA/m 16–240 kJ/m³ Approximately −0.03 to −0.05%/°C 250–350°C, depending on composition, grade, and mechanical design Approximately 700–850°C The curve shifts less with temperature than NdFeB because Br has a lower negative temperature coefficient. High-temperature stability is generally strong, although coercivity and irreversible loss still require verification at the actual operating point. 20°C, 150°C, 200°C, 250°C, and 300°C are common evaluation points. Use when thermal stability, corrosion resistance, and resistance to irreversible demagnetization are more important than maximum room-temperature energy density.
AlNiCo 0.6–1.35 T 40–160 kA/m 10–85 kJ/m³ Approximately −0.01 to −0.03%/°C 450–550°C, subject to alloy, geometry, and mechanical constraints Approximately 760–890°C Br changes relatively slowly with temperature, but Hcj is low compared with rare-earth magnets. The curve is therefore highly sensitive to external demagnetizing fields, unfavorable load lines, and magnetic-circuit changes. 20°C, 100°C, 200°C, 300°C, 400°C, and 500°C may be used for high-temperature characterization. Design the magnetic circuit to minimize demagnetizing fields. AlNiCo is well suited to high-temperature sensing and instrumentation when adequate magnetic-circuit protection is provided.
Hard Ferrite 0.20–0.45 T 150–400 kA/m 1.5–4.5 kJ/m³ Approximately −0.18 to −0.20%/°C 180–300°C, depending on grade and application requirements Approximately 450–580°C Br typically declines more rapidly with temperature than SmCo and AlNiCo. Hcj may show useful temperature behavior in some grades, but the reduced Br and operating-point shift must be included in the magnetic-circuit calculation. 20°C, 80°C, 120°C, 150°C, and 200°C are commonly used; higher points depend on the selected grade. Allow for relatively low magnetic output and a strong reversible change in Br. Ferrite is often selected for cost efficiency, corrosion resistance, and moderate-temperature applications.
Engineering note: The values shown are representative material ranges rather than supplier-specific guarantees. Actual demagnetization curves depend on grade, orientation, sintering or casting process, magnet geometry, magnetic load line, test method, and operating temperature. Final designs should use certified second-quadrant curves measured for the selected material and temperature range.

Which IEC 60404-5 Tests Validate Supplier Curve Accuracy

China Best Demagnetization Curves Suppliers for Global Buyers

For global buyers, curve accuracy begins with IEC 60404-5 testing, not attractive graphs. The standard evaluates permanent magnets through controlled hysteresis measurements. A supplier should provide coercivity, remanence, maximum energy product, and measurement uncertainty. Closed-circuit testing helps control the magnetic field. Open-circuit testing reveals practical demagnetization behavior. Both methods matter.

IEC 60404-5 also requires careful control of specimen geometry, field strength, and temperature. A reliable laboratory should show calibration records and repeatability results. ISO/IEC 17025 accreditation strengthens confidence in the measurement process. The U.S. Geological Survey reported about 350,000 metric tons of rare-earth mine production in 2023. That scale increases sourcing pressure, but volume does not guarantee accurate magnetic curves. A polished curve can still mislead. I have seen small temperature changes shift results noticeably, so buyers should question perfect-looking data.

Tips: Request raw test files, not only PDF charts. Compare at least three repeated measurements. Confirm the test temperature, sample dimensions, and demagnetizing-field correction. Ask whether the curve came from a closed or open magnetic circuit. Check the laboratory’s calibration date and uncertainty budget. Do not accept “IEC tested” without the actual test method. Supplier claims need evidence.

How ISO/IEC 17025 Laboratories Support Reliable Magnetic Data

For global buyers evaluating demagnetization curve suppliers, laboratory competence matters as much as equipment. An ISO/IEC 17025 laboratory follows documented methods, calibrated instruments, and controlled measurement conditions. Its scope should match the requested magnetic test, not merely display a certificate. Technicians record specimen grade, dimensions, orientation, temperature, and applied field steps. These details give a curve practical meaning. Without them, a neat graph may hide poor preparation or inconsistent saturation.

Reliable laboratories connect results to traceable reference standards and report measurement uncertainty. They check coil uniformity, sensor response, field reversal, and software settings before testing. Repeat measurements can reveal whether a sharp knee is material behavior or setup noise. Raw data, calibration records, and signed reports help buyers compare suppliers across countries. A supplier that welcomes technical questions usually shows stronger process maturity. Still, paperwork alone proves little. Not always. Scope and evidence matter.

Real work is rarely perfect. A sample may arrive with scratches, weak labeling, or unexpected magnetization history. Experienced technicians document these limits instead of quietly correcting the data. They may pause testing, request clarification, or mark an outlier for review. That honesty protects design decisions. Buyers should ask how specimens are conditioned, how demagnetization is defined, and whether uncertainty includes fixture effects. Curves can deceive. A defensible curve is better.

China Best Demagnetization Curves Suppliers for Global Buyers

Representative demagnetization behavior of common permanent-magnet material classes under increasing reverse magnetic field. The values use normalized remanent flux density (B/Br) and reflect typical engineering reference ranges rather than any individual supplier or brand.

ISO/IEC 17025 laboratories support reliable magnetic data by using calibrated field and flux-measurement equipment, documented test methods, traceable reference standards, controlled environmental conditions, and stated measurement uncertainty. Buyers can use these records to compare coercivity, magnetic stability, and batch consistency across suppliers.

How Global Buyers Compare China Suppliers by Tolerance, Data, and MOQ

Global buyers comparing China’s demagnetization curve suppliers should inspect more than a polished graph. The key question is whether each curve matches the required grade, temperature, and test direction. Ask for raw measurement files, not only a PDF image. A credible supplier states the magnet size, sampling interval, applied field, and instrument accuracy. Without these details, similar curves may support different decisions. Small labels matter.

Tolerance is often the first practical separator. Check coercivity, remanence, and energy-product limits against the purchase drawing. Request results from several production lots, because one excellent sample proves little. Independent laboratory verification can confirm repeatability for sensitive applications. I would also ask how failed readings are handled. Some reports omit them, which weakens confidence. That omission deserves discussion.

MOQ changes the real cost of comparison. A supplier offering 100 pieces may be more useful than one quoting a lower unit price at 10,000 pieces. Ask whether trial quantities use the same process, tooling, and inspection plan as mass production. Lead time, packaging, and replacement terms should appear in writing. Data can still be imperfect. Field-strength drift and operator judgment may affect results. A clear correction record is more valuable than a flawless-looking chart.

FAQS

What does a demagnetization curve show?

It shows how magnetic performance changes under opposing fields and rising temperatures. The curve reveals the working point after magnetization. A graph alone is not enough.

What is Br, and why does it matter?

Br is remanent flux density after the external field returns to zero. It indicates how much magnetic flux the material retains. Higher Br can support stronger output, but not always better system performance.

What is the difference between Hcb and Hcj?

Hcb is the field where magnetic flux density B reaches zero. Hcj is the field where intrinsic polarization J reaches zero. Hcj usually better indicates resistance to irreversible demagnetization. Confusing them can reduce design safety.

What does (BH)max tell engineers?

(BH)max represents the maximum energy product in the curve’s second quadrant. It estimates magnetic energy stored per unit volume. A higher value may allow a smaller magnet. It does not guarantee better performance.

How does temperature affect different magnetic materials?

Some high-energy materials lose flux quickly as temperature approaches the curve’s knee. Heat-resistant materials usually maintain more stable performance. Materials with lower coercivity can demagnetize under reverse fields. Ferrite often changes more gradually across common industrial temperatures.

Why should magnet geometry be included in curve analysis?

A long magnet and a short magnet can operate at different curve positions. Shape changes the magnetic circuit and working point. The same material grade may perform differently after assembly. Geometry matters.

What information should buyers request from a supplier?

Request raw curve files, test conditions, specimen dimensions, temperature, and test direction. Also check sampling intervals, applied fields, tolerances, and instrument accuracy. Ask for calibrated records from several production batches. One attractive graph proves little.

How can buyers verify curve repeatability?

Compare results from multiple samples and production lots. Independent laboratory testing can confirm sensitive measurements. Ask how failed readings are recorded and corrected. A perfect-looking report may still hide uncertainty. That deserves attention.

Conclusion

Demagnetization Curves provide essential information for evaluating permanent magnet performance, including residual induction (Br), coercive force (Hcj), intrinsic coercivity (Hcb), and maximum energy product ((BH)max). They also show how NdFeB, SmCo, AlNiCo, and ferrite materials respond to changing temperatures, helping engineers select suitable magnets for different operating environments. Accurate curves should be supported by standardized testing, including IEC 60404-5 methods, controlled measurement conditions, and repeatable calibration procedures.

For global buyers, ISO/IEC 17025-accredited laboratories add confidence by demonstrating technical competence, traceability, and reliable data management. When comparing China suppliers, buyers should review curve accuracy, material and temperature tolerances, test reports, consistency between batches, production capability, and minimum order quantities. A dependable supplier should provide clear technical documentation and data that matches actual product performance, enabling customers to make informed decisions for quality-sensitive applications.


Mason

Mason

Mason is a seasoned marketing professional with a deep expertise in the company's offerings and a passion for driving brand awareness. With a strong background in digital marketing strategies, he has an innate ability to connect with diverse audiences and effectively communicate product benefits.......